Sal Weather Briefing

Concept-driven operational weather view for Sal, Cape Verde — combining observations, briefing essentials, Tropical Atlantic context, numerical guidance, official Cape Verde services, and local interpretation for Harrys’ Point.

Tropical Atlantic GVAC + local spot view Harrys’ Point focus INMG Marine bulletins

1. Live observations

METAR and TAF via local PHP wrappers for Sal and Boa Vista.

Source: Aviation Weather Center (NOAA) METAR/TAF data via local PHP wrappers.

GVAC
Amílcar Cabral / Sal
METAR GVAC 151900Z 03014KT 9999 SCT014 26/21 Q1013 NOSIG

TAF GVAC 151700Z 1518/1624 03015KT 9999 SCT014
GVBA
Aristides Pereira / Boa Vista
METAR GVBA 151900Z 02011KT 9999 BKN014 26/22 Q1013 NOSIG

TAF GVBA 151700Z 1518/1618 03013KT 9999 SCT014

Reference station (mid-latitude comparison):

EDDF:METAR EDDF 151850Z AUTO 05013KT CAVOK 28/12 Q1017 NOSIG

TAF EDDF 151700Z 1518/1624 04010KT CAVOK 
  BECMG 1522/1524 03005KT 
  BECMG 1613/1616 18006KT 
  PROB30 
  TEMPO 1613/1620 21015G30KT TSRA SCT050CB

2. Daily context · Sal

Local time reference, sun, UV and tide in one compact block.

Source: PHP sun calculations, Open-Meteo UV API, Wisuki tide page.

Location Sunrise Transit Sunset
Sal (SID) 06:06 12:37 19:08
Frankfurt (FRA) 05:33 13:31 21:30
UV now 1.9 · Low
UV max today 9 · Very high

3. Synoptic situation · Tropical Atlantic

Surface analysis for the wider Atlantic background: Azores High, ITCZ, monsoon trough, tropical waves, trade-wind gradient and pressure systems. A satellite view for Western Africa is linked below as an additional real-time observation.

Source: NOAA / NHC / TAFB surface analysis, EUMETSAT Meteosat imagery, CPC NAO index, WMO METAREA II, NOAA marine products.

NOAA Tropical Surface Analysis

4. GVAC wind history · last 24h

METAR-derived wind speed and direction for a backward look.

Source: Aviation Weather METAR history for GVAC.

5. Cape Verde weather service and bulletins

Instituto Nacional de Meteorologia e Geofísica (INMG) provides the official Cabo Verde forecast context. Marine bulletins are issued for the full archipelago as well as for specific regions.

For Sal, the most relevant reference is the Barlavento Oriental bulletin (Sal / Boa Vista), complemented by the general archipelago bulletin for broader context.

Source: INMG official marine weather bulletins.

Barlavento Occidental: western windward sector.
Barlavento Oriental: eastern windward sector, including Sal and Boa Vista.
Sotavento: southern / leeward sector.
Typical bulletin content: wind direction, Beaufort range, wave height and short regional outlook.
Use on this page: official regional reality check against the model view for Sal.
Latest available bulletins: hosted locally for stability and direct access.

Bulletins hosted locally for stability. Forecast source attributed to Instituto Nacional de Meteorologia e Geofísica (INMG). Special thanks to INMG for providing the marine weather bulletins.

6. Local wind interpretation · Harrys’ Point · N16°35.4′ W022°53.4′

This section is about local reading, not about model output. Airport observations are useful, but Harrys’ Point must be interpreted with coastal acceleration, cape effects, shoreline geometry and local exposure in mind.

Source: local interpretation based on GVAC, OpenSeaMap, Windy, Windguru and PredictWind.

coastal acceleration cape effect local thermal influence airport ≠ spot
Reference point: Harrys’ Point is named after the famous and well-known singer-songwriter Harry Kaey.
Operational reading: Compare airport truth, synoptic setup and model background before judging the beach.
Map anchor: Use the local map position to keep the exposure and coastline geometry in mind.
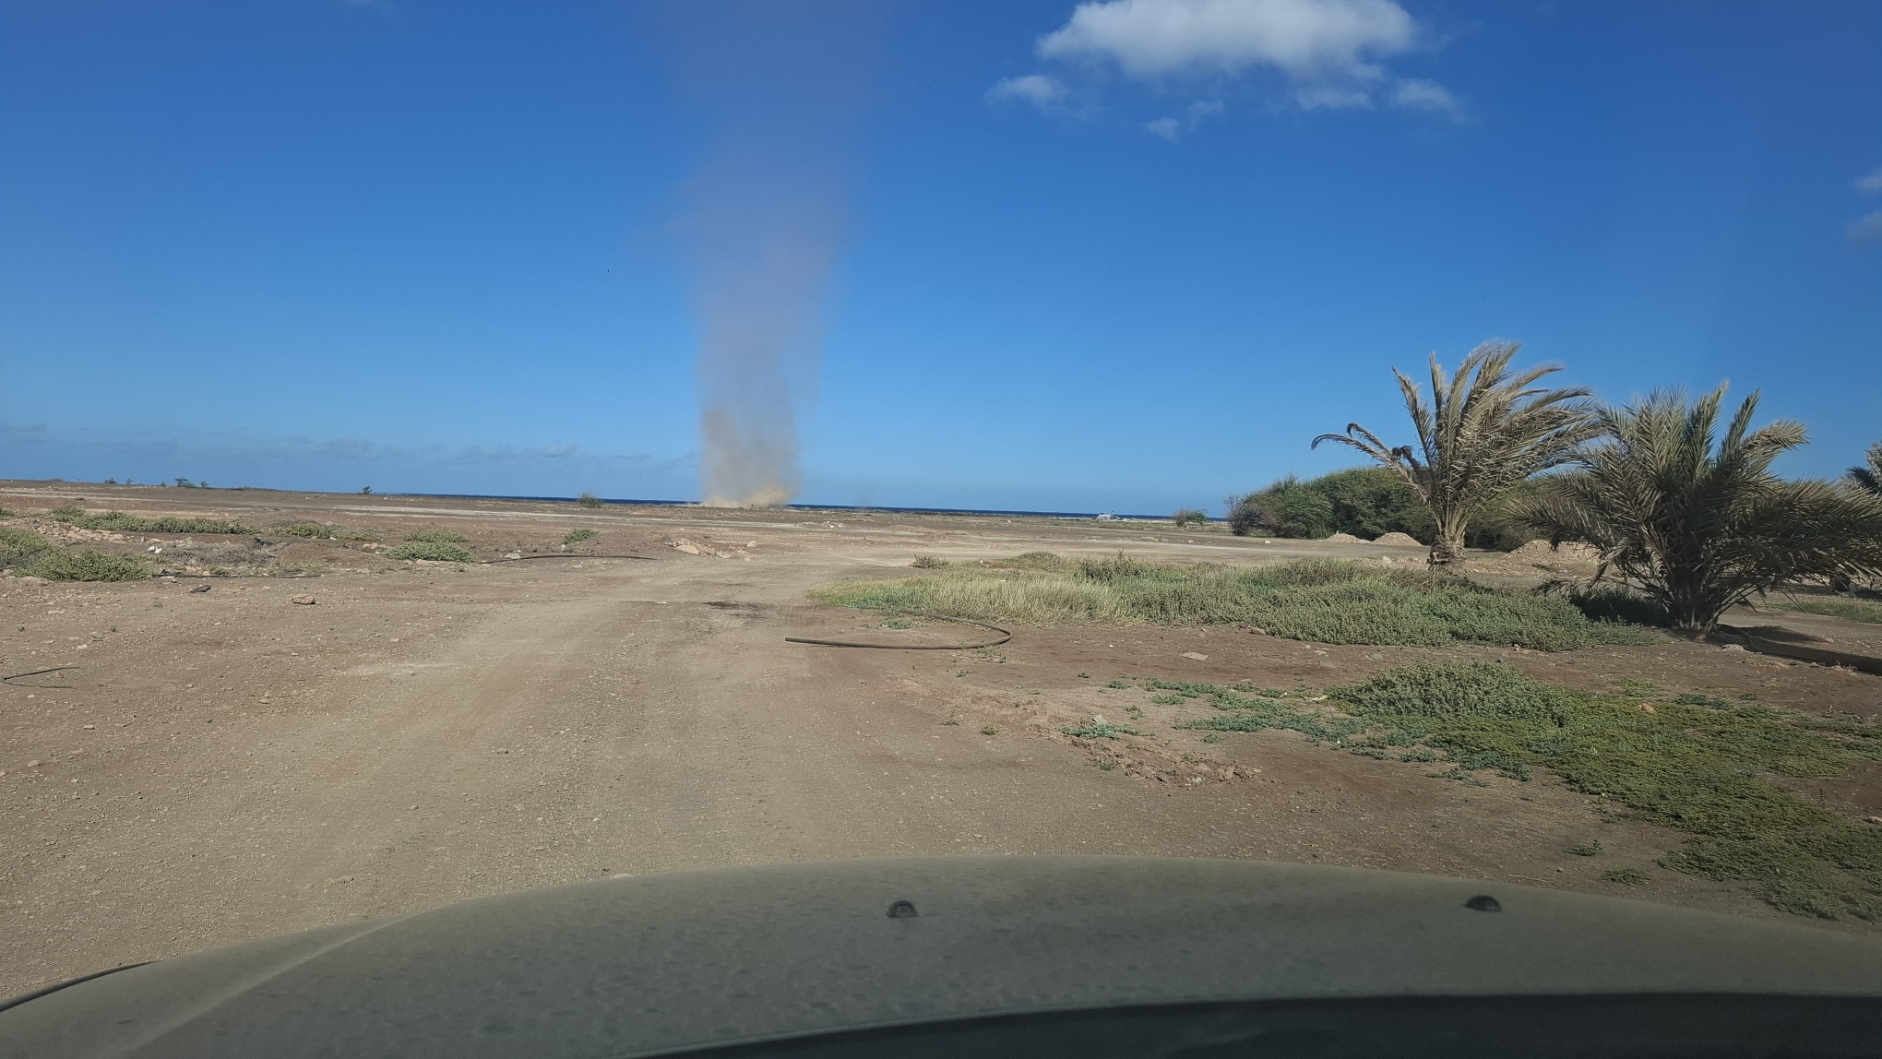
Local convection: Small-scale thermal activity (e.g. dust devils) confirms local heating effects, but rarely alters the trade wind regime.

OpenSeaMap marker: Harrys’ Point is linked with an explicit map marker and centered map view.

Marine format: N16°35.4′ · W022°53.4′
Decimal: 16.590556, -22.889722

7. Numerical model guidance

Source: local JSON forecast package generated on the VPS from ECMWF IFS / ECWAM context. Model comparison (GFS, ICON Global) is planned for future integration.

Model comparison mindset

Use ECMWF as primary reference; wave context is provided by ECWAM. GFS and ICON Global will be added for structured comparison. Differences matter more than slogans.

ECMWF IFS GFS (planned) ICON Global (planned) ECWAM

ECMWF / local point forecast

Primary local model guidance for Harrys’ Point and Matts’ Point. Harrys’ Point is derived through bilinear interpolation from the surrounding model grid, while Matts’ Point currently uses a sea-side coastal override.

Current local data package: Run 2026071500 · updated 15 Jul 07:30 (Cape Verde time)

Harrys' Point

Full forecast 0–72h · ECMWF IFS HRES · Run 2026071500 · generated 15 Jul 07:39 (Cape Verde time)

Selection method: bilinear interpolation

StepLocal time10 m windGustWavePeriodCloud
0h14 Jul 21:0010.2 kt NE01.2 m NNE6.6 s25%
3h15 Jul 00:009.6 kt N12.81.1 m NNE6.7 s78%
6h15 Jul 03:0015.4 kt N19.61.1 m N6.4 s64%
9h15 Jul 06:0014.2 kt NNE21.11.2 m NNE6 s26%
12h15 Jul 09:009.6 kt NNE15.91.1 m NNE6.1 s5%
15h15 Jul 12:0010.6 kt NNE14.71 m NNE6.3 s1%
18h15 Jul 15:0012.2 kt N16.21 m N6.2 s0%
21h15 Jul 18:0011.5 kt N15.31 m N6.2 s1%
24h15 Jul 21:0010.8 kt N14.50.9 m N6.4 s13%
27h16 Jul 00:0010.1 kt N13.50.9 m N6.5 s15%
30h16 Jul 03:0011.3 kt N14.70.9 m N6.5 s12%
33h16 Jul 06:0013.9 kt N18.21 m N6.2 s11%
36h16 Jul 09:0012.4 kt NNE171 m N6.1 s5%
39h16 Jul 12:0010.4 kt NE14.81 m N6.3 s0%
42h16 Jul 15:0010.9 kt NE14.80.9 m N6.5 s0%
45h16 Jul 18:009.6 kt NE140.9 m N6.7 s0%
48h16 Jul 21:0010.4 kt ENE13.61 m NNE6.8 s21%
51h17 Jul 00:008.7 kt NE12.21 m NNE7.1 s50%
54h17 Jul 03:0011.2 kt ENE14.61 m NNE7.1 s17%
57h17 Jul 06:0013.2 kt ENE171.1 m NE6.8 s63%
60h17 Jul 09:0013.9 kt E18.91.2 m ENE6.7 s52%
63h17 Jul 12:0012.1 kt ESE16.91.2 m E7 s47%
66h17 Jul 15:009.9 kt SE14.31.2 m ESE7.2 s72%
69h17 Jul 18:006.8 kt SE10.21.2 m ESE7.2 s8%
72h17 Jul 21:007.5 kt ESE9.71.1 m ESE7.2 s7%

Matts' Point

Full forecast 0–72h · ECMWF IFS HRES · Run 2026071500 · generated 15 Jul 07:39 (Cape Verde time)

Selection method: nearest

StepLocal time10 m windGustWavePeriodCloud
0h14 Jul 21:0010.7 kt NNE01.6 m NNE6.8 s6%
3h15 Jul 00:0010.9 kt N141.5 m NNE6.9 s60%
6h15 Jul 03:0016.5 kt NNE20.71.5 m NNE6.6 s61%
9h15 Jul 06:0014.6 kt NNE22.51.5 m NNE6.3 s20%
12h15 Jul 09:009.5 kt NNE14.51.4 m NNE6.4 s4%
15h15 Jul 12:0010.6 kt N13.71.3 m NNE6.4 s6%
18h15 Jul 15:0012.8 kt N16.31.3 m NNE6.3 s0%
21h15 Jul 18:0012.1 kt N15.51.2 m NNE6.3 s3%
24h15 Jul 21:0011.7 kt N151.2 m NNE6.3 s7%
27h16 Jul 00:009.9 kt N141.2 m NNE6.5 s9%
30h16 Jul 03:0012.2 kt N15.61.2 m NNE6.5 s3%
33h16 Jul 06:0014.3 kt N18.31.2 m NNE6.3 s3%
36h16 Jul 09:0011.8 kt NNE16.41.2 m NNE6.4 s0%
39h16 Jul 12:009.3 kt NNE12.71.2 m NNE6.7 s0%
42h16 Jul 15:0010.5 kt NE13.41.2 m NNE6.8 s0%
45h16 Jul 18:009.5 kt NE13.71.2 m NNE6.9 s0%
48h16 Jul 21:0010.4 kt ENE13.41.3 m NNE7.1 s5%
51h17 Jul 00:008.5 kt NE11.91.3 m NNE7.4 s42%
54h17 Jul 03:0010.9 kt ENE13.51.4 m NE7.5 s10%
57h17 Jul 06:0012.7 kt ENE15.81.5 m NE7.4 s20%
60h17 Jul 09:0012.1 kt E16.11.6 m ENE7.4 s17%
63h17 Jul 12:008.9 kt E12.81.6 m E7.5 s38%
66h17 Jul 15:009 kt SE11.11.7 m ESE7.6 s28%
69h17 Jul 18:006.4 kt SE8.71.6 m ESE7.5 s15%
72h17 Jul 21:006.7 kt ESE8.71.5 m ESE7.4 s5%

8. Saharan dust

Dust matters for visibility, air quality and for the overall character of the day, even when the wind itself looks straightforward.

Source: ECMWF CAMS aerosol products and AEMET dust products.

Operational effect: reduced visibility and a different visual feel to the atmosphere.
Interpretation effect: useful context when the day feels flatter, dirtier or less clear than the wind charts alone suggest.
Workflow: check dust context deliberately alongside the synoptic and model view.

9. Visual observations · Sal

Visual observations provide real-time confirmation of local conditions as well as examples of typical small-scale phenomena on Sal.
Live webcam: real-time view of local wind and sea state conditions.
Local observation: Dust devil · own observation · N16°37′ W022°54′ · 23 March 2026 1724 UTC.